In this post Lucas will show you how to query historic logs for your OpenFaaS functions using Grafana Loki and the openfaas-loki log provider.
Logs are critical to observing and debugging systems once in production. OpenFaaS builds in support for logs in every installation. But it can be even better by using a new log provider. In this post we will show you how to supercharge the logs by installing Grafana’s Loki and configure OpenFaaS to use Loki.
Motivation
In the default installation of OpenFaaS, the logs come from the underlying orchestration tool. This is great, because logs are automatically available without any additional effort, but this means logs only exist for the current function instances. This means that as your function scales from 0 to 100 and then back to 0, you will no long have access to the function logs because the orchestraition system does not keep logs after the function instance is removed! This is simply the default behavior of systems like Docker Swarm and Kubernetes. If a user reports and error, but the function instance has scaled down already, the logs you need to debug the issue are now gone.
Sometimes it’s important to retrieve the logs for function invocations from several days or even weeks ago. To achieve that, we need to aggregate, store and index the logs from each function. Traditionally, this has meant installing the ELK stack: ElasticSearch, Logstash, Kibana. This is a great and well established tool; but, in late 2018 Grafana introduced a new alternative aimed squarely at the Cloud Native world: Loki.
Loki is a horizontally-scalable, highly-available, multi-tenant log aggregation system inspired by Prometheus. It is designed to be very cost effective and easy to operate. It does not index the contents of the logs, but rather a set of labels for each log stream.
Loki is a light-weight tool that’s easy to use. When it comes to Kubernetes, deployment is simple through the project’s Helm chart.
Once a log aggregator is installed and configured it will often have a UI for exploring the logs, for ELK this is Kibana and for Loki it is Grafana Explore.
Since OpenFaaS Gateway 0.15.0+ (July 2019), OpenFaaS supports pluggable logging providers to support streaming function logs via the Gateway API and the faas-cli. With the latest release of arkade all three (OpenFaaS, Loki, and Grafana) can be installed in just a few lines, allowing you to access the same function logs from the faas-cli, the API, or the Grafana Explore dashboard. We will walk-though the steps below.
Prerequisites
Before we start we need a couple of tools to help us quickly set up our environment:
- docker - required to use KinD
- kind - a tool for running local Kubernetes clusters using Docker
- arkade - official installer for OpenFaaS, that supports many other applications for Kubernetes
- faas-cli - the CLI which communicates with the OpenFaaS gateway
- kubectl - the CLI which communicates with your Kubernetes cluster
Prepare environment
Before showing you how to run our functions on a schedule, first we need to set up the environment with the tools mentioned above.
Create cluster
First thing we need is running Kubernetes cluster:
kind create cluster
Wait for the installation to finish run this command to verify that the cluster is ready:
kubectl -n kube-system rollout status deployment/coredns
Install OpenFaaS
With arkade the installation of OpenFaaS boils down to single line command:
arkade install openfaas
Wait for the OpenFaaS gateway to be ready
kubectl rollout status -n openfaas deploy/gateway
Install faas-cli
The faas-cli can also be installed via arkade
arkade get faas-cli
Deploy a sample function
To test the logs we can use any function from the function store, for example, Cows is a fun function. Note that we need to forward the OpenFaaS API to a local port and login to OpenFaaS first
kubectl port-forward -n openfaas svc/gateway 8080:8080 &
kubectl get secret -n openfaas basic-auth -o jsonpath="{.data.basic-auth-password}" | base64 --decode | faas-cli login --username admin --password-stdin
faas-cli store deploy "ASCII Cows"

faas-cli invoke cows <<< ""
         ____
        (____)

         (__)
         (oo)
  /-------\/
 / |     ||
*  ||----||
   ~~    ~~
   holy cow
We can see the logs powered by Kubernetes using
faas-cli logs cows
WARNING! Communication is not secure, please consider using HTTPS. Letsencrypt.org offers free SSL/TLS certificates.
Handling connection for 8080
2020-06-27T16:37:13Z 2020/06/27 16:37:13 Version: 0.13.0	SHA: fa93655d90d1518b04e7cfca7d7548d7d133a34e
2020-06-27T16:37:13Z 2020/06/27 16:37:13 Read/write timeout: 5s, 5s. Port: 8080
2020-06-27T16:37:13Z 2020/06/27 16:37:13 Writing lock-file to: /tmp/.lock
2020-06-27T16:37:13Z 2020/06/27 16:37:13 Metrics server. Port: 8081
2020-06-27T16:37:17Z 2020/06/27 16:37:17 Forking fprocess.
2020-06-27T16:37:17Z 2020/06/27 16:37:17 Wrote 119 Bytes - Duration: 0.130287 seconds
We will see a slightly different format when we switch to Loki later.
Install Loki and Grafana
With arkade, we need this single line to install both Grafana and Loki:
arkade install loki --grafana
Wait for Loki and Grafana to be ready:
kubectl rollout status deployment loki-stack-grafana
Now get your admin password and forward the Grafana port
kubectl get secret loki-stack-grafana -o jsonpath="{.data.admin-password}" | base64 --decode ; echo
kubectl port-forward service/loki-stack-grafana 3000:80 &
Then open http://localhost:3000 and login using username admin.
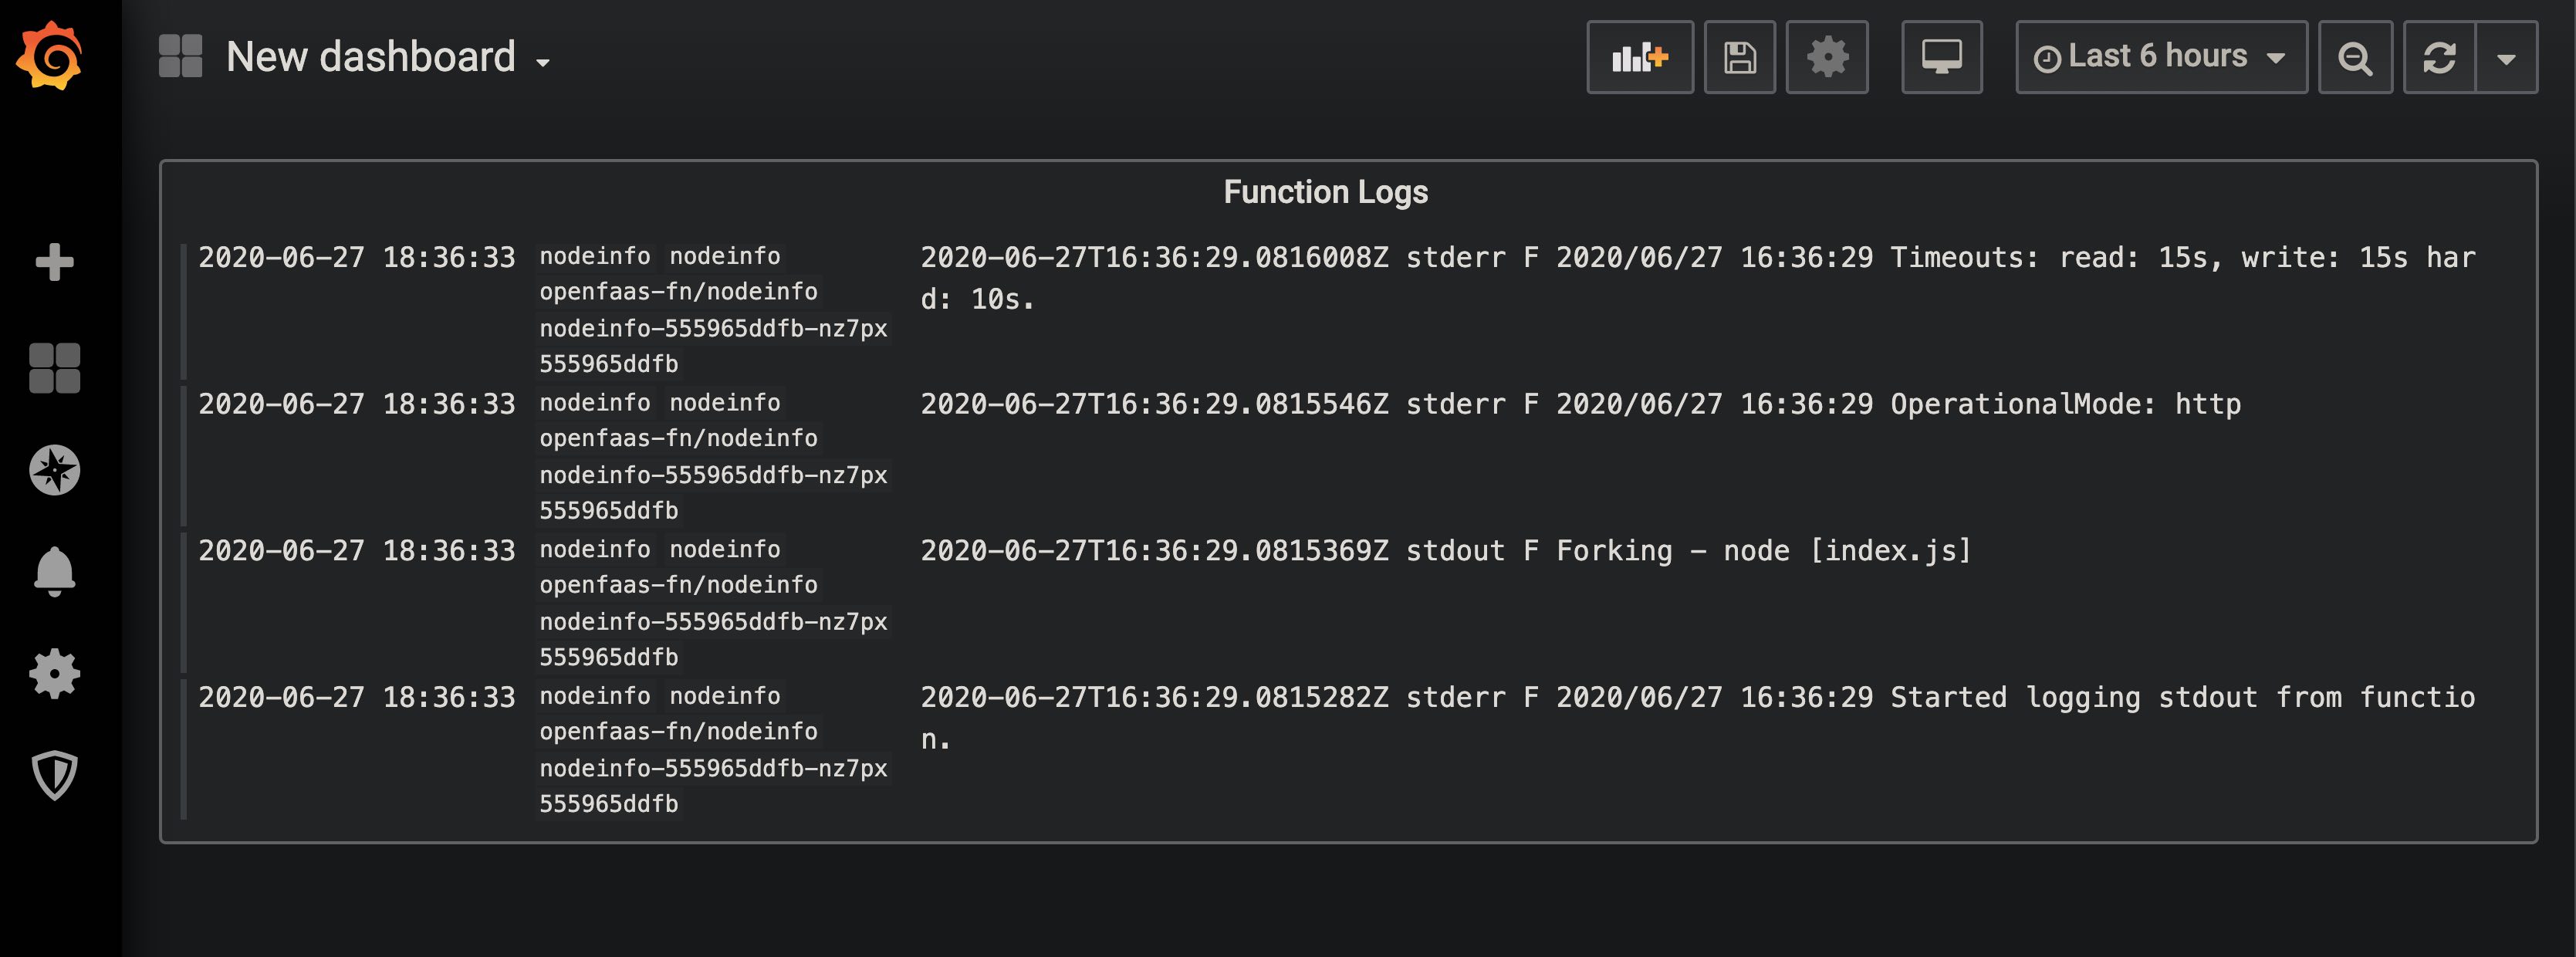
Loki will automatically start collecting logs from all of the Pods it can sees. Meaning you should see logs immediately. Importantly, this means you can see the logs for all of the OpenFaaS components, like the Gateway.
This link will show you the logs (over the last hour) for the Gateway we just installed!
Loki, when installed in Kubernetes, will automatically create a search index for each of the lables on the Pods it sees. Important, this means the Loki query for the logs of an OpenFaaS function looks like {faas_function="<name>"} because OpenFaaS always adds the function name as the label faas_function. This link will show the logs for the Cows function we installed and invoked.
Installing openfaas-loki
Now let’s configure OpenFaaS to fetch its logs from Loki.
arkade install openfaas-loki
We then need to configure the OpenFaaS installation, we can do this with arkade using the --set flag
arkade install openfaas --set gateway.logsProviderURL=http://openfaas-loki.default:9191/
Testing the logs
Recreate the port-forward
Earlier, while we were installing and verifying the system, we ran this command
kubectl port-forward -n openfaas svc/gateway 8080:8080 &
Unfortunately, that connection is no longer valid, because we updated the OpenFaaS installation to configure the logs provider. We need to stop the current port-forward command and then start a new one:
killall kubectl
kubectl port-forward -n openfaas svc/gateway 8080:8080 &
Invoke the function and check the logs
Now we can use the faas-cli to invoke and see the logs, this time powered by Loki.
echo "" | faas-cli invoke cows
             ___   ___
             \  \  \  \
   (___)   ___\__\__\__\__
   (o o)   |  O O O O O O|
  --\ /----+-------------+-------/
  |  O                          /
   \                           /
~~~~~~~~~~~~~~~~~~~~~~~~~~~~~~~~~~~~~~~~~~~~~~s~~~~~~~~~~~
         Steerage
and
faas-cli logs cows
2020-06-27T18:24:09Z 2020-06-27T18:24:09.633228Z stderr F 2020/06/27 18:24:09 Forking fprocess.
2020-06-27T18:24:09Z 2020-06-27T18:24:09.8101492Z stderr F 2020/06/27 18:24:09 Wrote 279 Bytes - Duration: 0.176972 seconds
To compare with the Kubernetes powered logs
2020-06-27T16:37:17Z 2020/06/27 16:37:17 Forking fprocess.
2020-06-27T16:37:17Z 2020/06/27 16:37:17 Wrote 119 Bytes - Duration: 0.130287 seconds
We see a slightly different format that is coming from the way Loki scrapes the logs. Primarily
2020-06-27T18:24:09.633228Z stderr F
This shows the timestamp for when the log was collected and that it came from stderr instead of stdout.
We can also demonstrate that the logs are now independently stored from the function instance by scaling the function to 0 and still retrieving the same logs
kubectl -n openfaas-fn scale deployment --replicas 0 cows
faas-cli logs cows
2020-06-27T18:24:09Z 2020-06-27T18:24:09.633228Z stderr F 2020/06/27 18:24:09 Forking fprocess.
2020-06-27T18:24:09Z 2020-06-27T18:24:09.8101492Z stderr F 2020/06/27 18:24:09 Wrote 279 Bytes - Duration: 0.176972 seconds
Note: The
faas-cli logsdefaults to the last 5 mins of logs. If you walk through this tutorial and have a long pause between steps, it is possible that your logs will be empty because of the gap between your invocation and the request. Just run the invoke command again and then get the logs. You can extend the time frame using the--sinceflag, for example:faas-cli logs cows --since=10m
Wrapping up
In this post we have shown how you can use Loki and OpenFaaS together so that your function logs are stored independently from the instances. The combination of Loki and Grafana make it even easier to debug functions than before. You can even create dashboards that combine function metrics and logs in one place by using the new logs panel
If you have other ideas or hacks with Grafana, or would like to help us add another logs provider for your favorite aggregator (e.g. ELK), please connect with the community.
- Read the docs on the Logs Provider interface and checkout the example in the provider repo
- If you have any suggests or issues with Loki let us know on the
openfaas-lokirepo