Learn how to combine the power of R with Serverless for data science.
Introduction
Intro by Alex Ellis: “This is a guest post by Peter Solymos. Peter reached out to me after becoming an OpenFaaS Sponsor. He wanted to help other data-scientists like himself understand the value of combining R with functions in the cloud. Hope you enjoy the post and feel free to reach out to us via Twitter
In this post I will introduce you to the R templates for OpenFaaS, then I will build a function that pulls data from a COVID-19 API, fits a time series model to the data, and makes a forecast for the future case counts.
This post is written for existing OpenFaaS users, if you’re new then you should try deploying OpenFaaS and following a tutorial to get a feel for how everything works. Why not start with this course? Introduction to Serverless course by the LinuxFoundation
Why R?
R is one of the most popular languages for data science. R’s strength is in statistical computing and graphics. Is popularity has been growing steadily as measured by the increase in Stack Overflow questions. R’s use is most prominent in disciplines relying on classical statistical approaches, such as academia, healthcare/biostatistics, environmental sciences, and finance, just to mention a few. What makes R ideal in these disciplines is the immediate access to latest statistical methods which often get published as extension packages alongside journal articles.
R’s huge ecosystem of extension packages (currently more than 14 thousand in CRAN repositories, not counting packages on GitHub etc.) is driving the growth of R and the community around it. Some of the most well known packages include ggplot2 for the grammar of graphics, and dplyr for the grammar of data manipulation, both part of the tidyverse.
Besides the interactive data wrangling use cases, R is also a capable scripting language from the command line, and has powerful web server frameworks for building interactive applications or publishing APIs with minimal effort. This post naturally ties into these frameworks. So let’s dive right into how to turn your first R script into a serverless function using faas-cli templates.
The R templates
Use the faas-cli and pull R templates:
faas-cli template pull \
  https://github.com/analythium/openfaas-rstats-templates
Now faas-cli new --list should give you a list with the available R/rstats templates to choose from (rstats refers to the #rstats Twitter hashtag used for R related posts). The templates differ with respect to the Docker base image, the OpenFaaS watchdog type, and the server framework used.
You can choose between the following base images:
- Debian-based
rocker/r-baseDocker image from the rocker project for bleeding edge, - Ubuntu-based
rocker/r-ubuntuDocker image from the rocker project for long term support (uses RSPM binaries for faster R package installs), - Alpine-based
rhub/r-minimalDocker image from the r-hub project for smallest image sizes.
The use of Docker with R is discussed in the original article introducing the Rocker project and also in a recent review of the Rockerverse, packages and applications for containerization with R.
The template naming follows the pattern rstats-<base_image>-<server_framework>. Templates without a server framework (e.g. rstats-base) use the classic watchdog which passes in the HTTP request via STDIN and reads a HTTP response via STDOUT. The other templates use the he HTTP model of the of-watchdog that provides more control over your HTTP responses and is more performant due to caching and pre-loading data and libraries.
R has an ever increasing number of server frameworks available. There are templates for the following frameworks (R packages): httpuv, plumber, fiery, beakr, ambiorix. Each of these frameworks have their own pros and cons for building standalone applications. But for our serverless purposes, the most important aspect of picking one comes down to support and ease of use.
In this post I focus on the plumber R package and the rstats-base-plumber template. Plumber is one of the oldest of these frameworks. It has gained popularity, corporate adoption, and there are many examples and tutorials out there to get you started.
Make a new function
Let’s define a few variables then use faas-cli new to create a new function called covid-forecast based on the rstats-base-plumber template:
# Populate with your registry prefix or Docker Hub username
export OPENFAAS_PREFIX=""

# Populate with your OpenFaaS URL
export OPENFAAS_URL="http://174.138.114.98:8080"

faas-cli new --lang rstats-base-plumber \
  covid-forecast --prefix=$OPENFAAS_PREFIX
Your folder now should contain the following files:
# ls

covid-forecast/handler.R
covid-forecast/DESCRIPTION

covid-forecast.yml
The covid-forecast.yml is the stack file used to configure functions (read more here). You can now edit the files in the covid-forecast folder.
Time series forecast
I will use exponential smoothing as a time series forecasting method. The method needs time series data, that is a series of numeric values collected at some interval. I use here daily updated COVID-19 case counts. The data source is the Center for Systems Science and Engineering (CSSE) at Johns Hopkins University. The flat files provided by the CSSE are further processed to provide a JSON API (read more about the API and its endpoints, or explore the data interactively here).
Customize the function
The covid-forecast/handler.R contains the actual R code implementing the function logic. You’ll see an example for that below. The dependencies required by the handler need to be added to the covid-forecast/DESCRIPTION file. See how the dependencies specified in the DESCRIPTION file are installed here.
See worked examples for different use cases. Read more about the structure of the templates if advanced tuning is required, e.g. by editing the
Dockerfile, etc.
Add the forecast R package to the covid-forecast/DESCRIPTION file:
Package: COVID
Version: 0.0.1
Imports:
  forecast
Remotes:
SystemRequirements:
VersionedPackages:
Change the covid-forecast/handler.R file:
library(forecast)

covid_forecast <- function(region, cases, window, last) {
  ## API endpoint for region in global data set
  u <- paste0("https://hub.analythium.io/covid-19/api/v1/regions/", region)
  x <- jsonlite::fromJSON(u) # will throw error if region is not found
  ## check arguments
  if (missing(cases))
    cases <- "confirmed"
  cases <- match.arg(cases, c("confirmed", "deaths"))
  if (missing(window))
    window <- 14
  window <- round(window)
  if (window < 1)
    stop("window must be > 0")
  ## time series: daily new cases
  y <- pmax(0, diff(x$rawdata[[cases]]))
  ## dates
  z <- as.Date(x$rawdata$date[-1])
  ## trim time series according to last date
  if (!missing(last)) {
    last <- min(max(z), as.Date(last))
    y <- y[z <= last]
    z <- z[z <= last]
  } else {
    last <- z[length(z)]
  }
  ## fit exponential smoothing model
  m <- ets(y)
  ## forecast based on model and window
  f <- forecast(m, h=window)
  ## processing the forecast object
  p <- cbind(Date=seq(last+1, last+window, 1), as.data.frame(f))
  p[p < 0] <- 0
  as.list(p)
}

#* COVID
#* @get /
function(region, cases, window, last) {
  if (!missing(window))
    window <- as.numeric(window)
  covid_forecast(region, cases, window, last)
}
The R script loads the forecast package, defines the covid_forecast function with 4 arguments:
region: a region slug value for the API endpoint in global data set (see available values),cases: one of"confirmed"or"deaths",window: a positive integer giving the forecast horizon in days,last: last day ("YYYY-MM-DD"date format) of the time series to consider.
The function gives the following output in R:
covid_forecast("canada-combined", cases="confirmed", window=4, last="2021-02-18")
# $Date
# [1] "2021-02-19" "2021-02-20" "2021-02-21" "2021-02-22"
# $`Point Forecast`
# [1] 2861.592 2871.802 2879.980 2886.529
# $`Lo 80`
# [1] 1694.809 1695.439 1686.198 1667.680
# $`Hi 80`
# [1] 4028.375 4048.165 4073.761 4105.377
# $`Lo 95`
# [1] 1077.152 1072.711 1054.249 1022.461
# $`Hi 95`
# [1] 4646.033 4670.894 4705.710 4750.596
The result of the call is a list with six elements, all elements are vectors of length 4 which is our time window. The Date element gives the days of the forecast, the Point Forecast is the expected value of the prediction, whereas the lower (Lo) and upper (Hi) prediction intervals represent the uncertainty around the point forecast. The 80% interval (within the Lo 80 and Hi 80 bound) and the 95% interval means that the 80% or 95% of the future observations will fall inside that range, respectively.
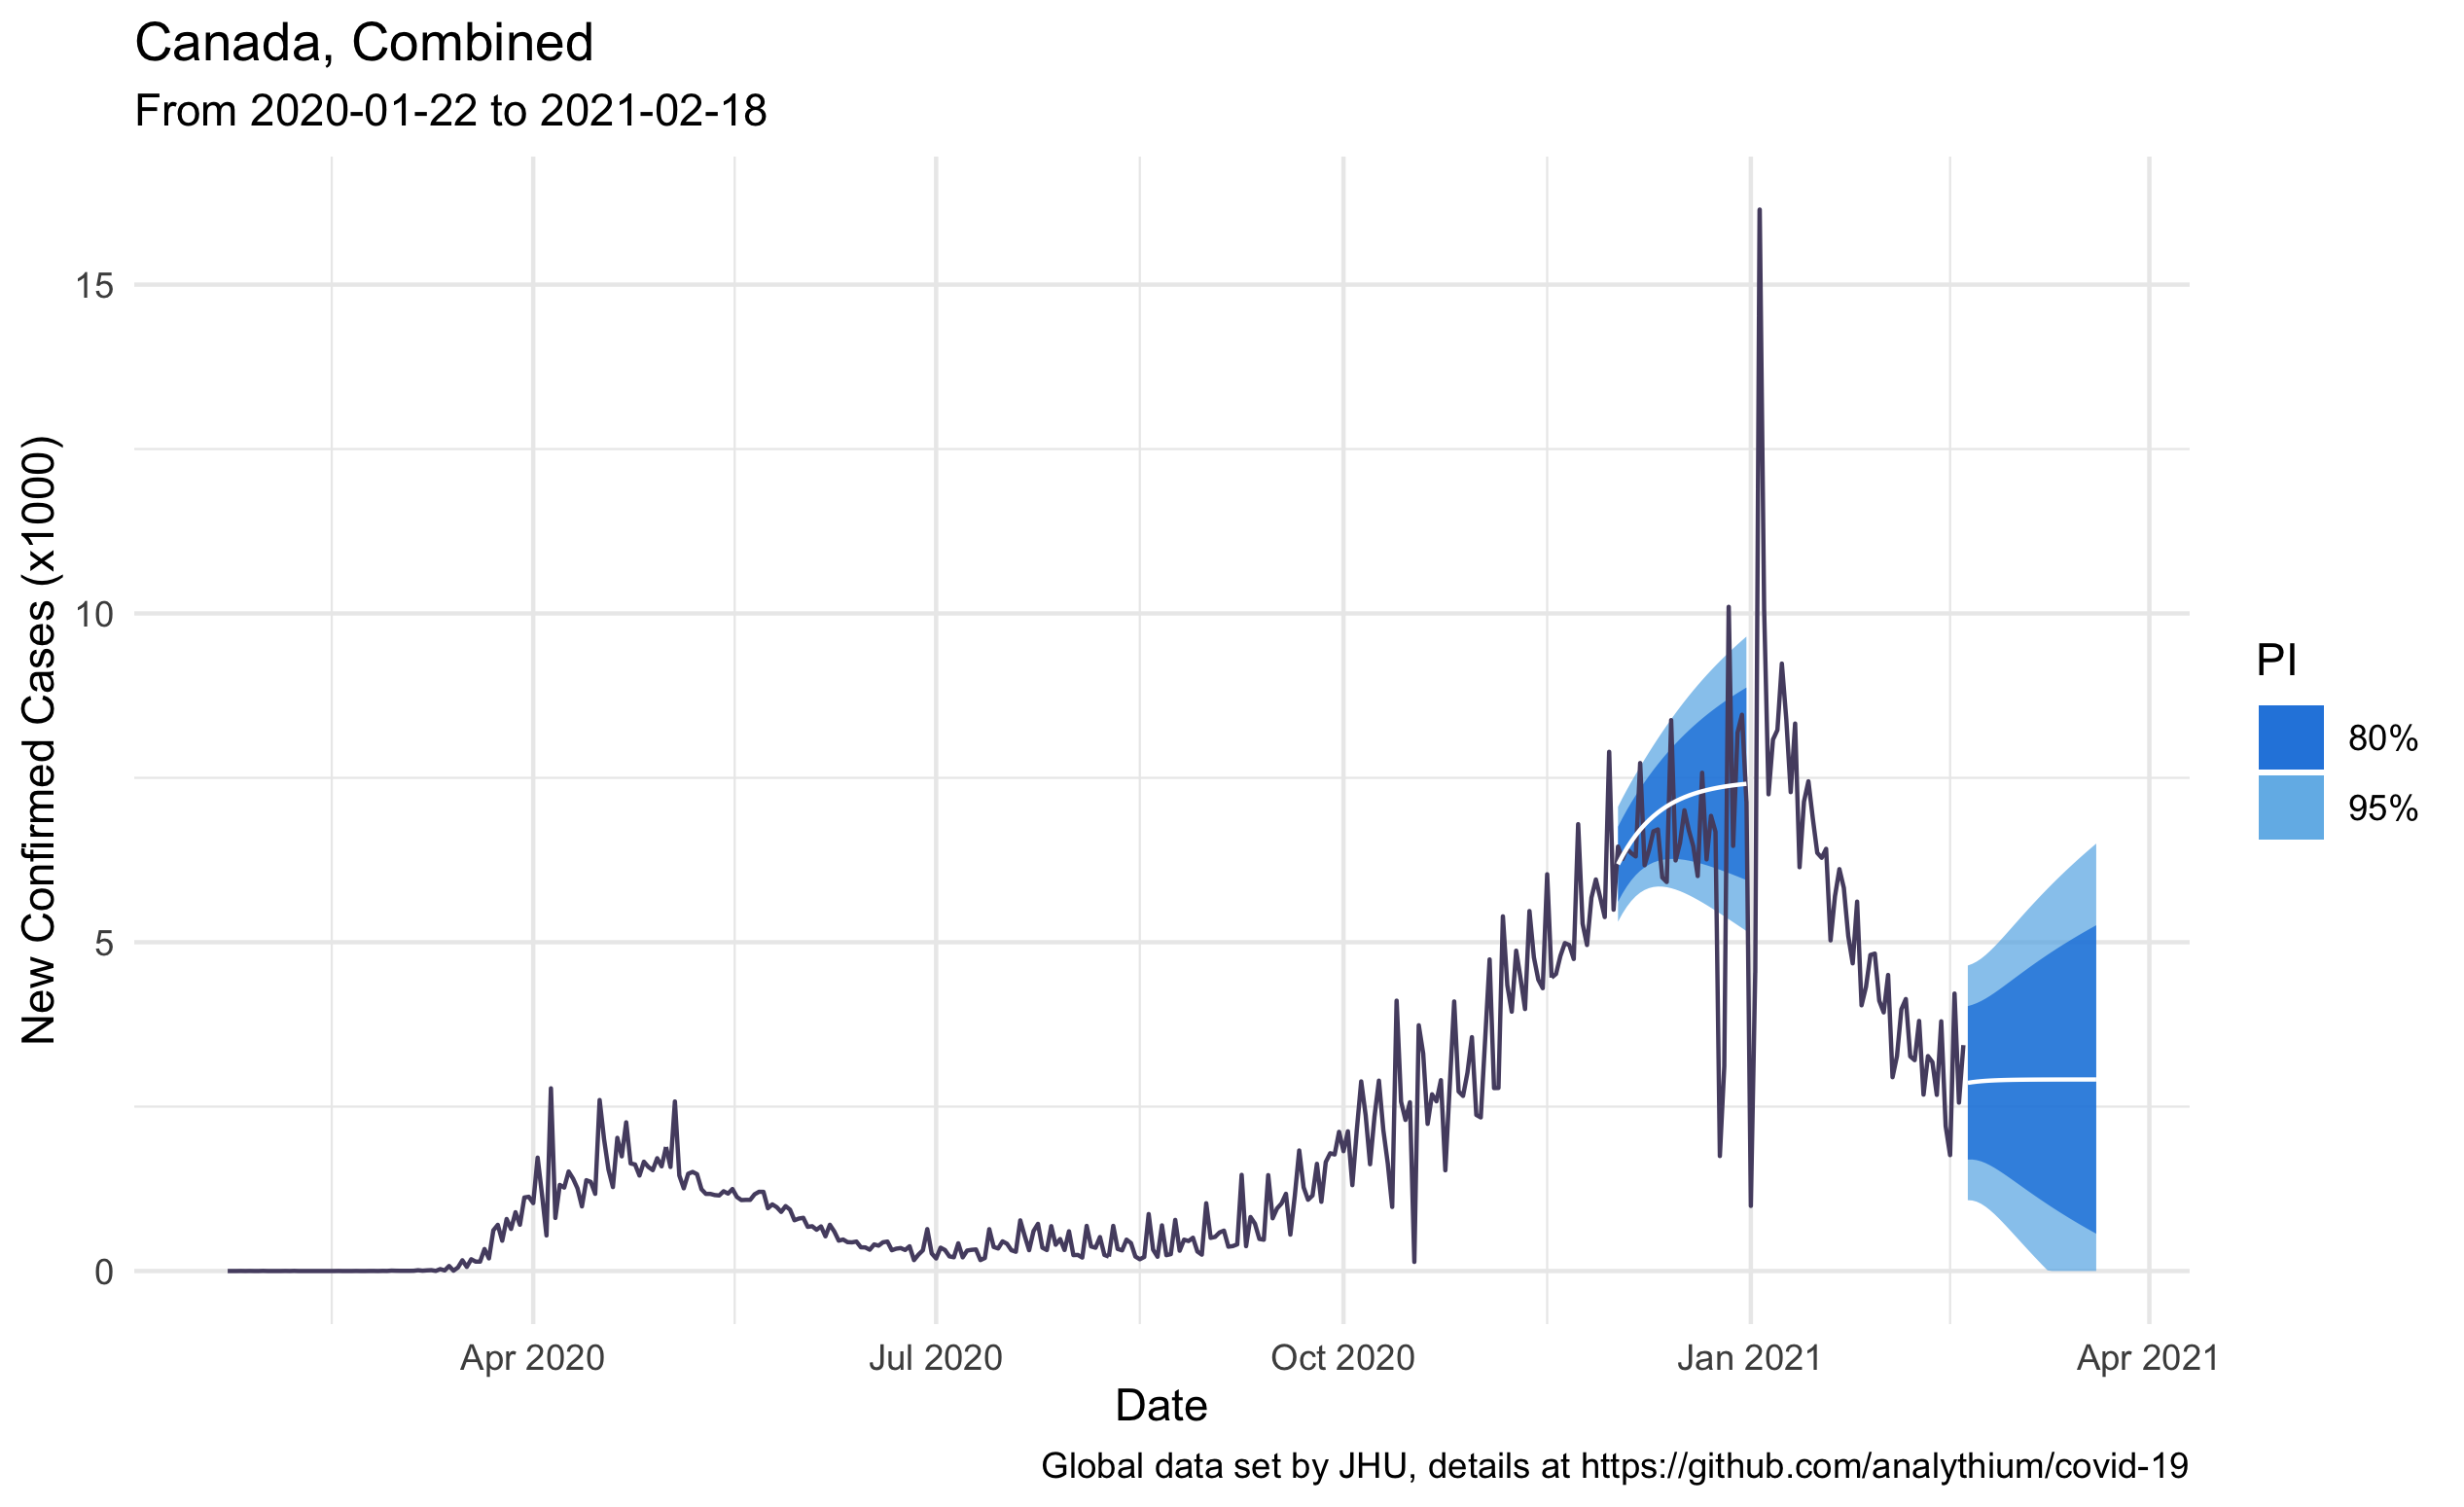
The following plot combines the historical daily case counts and the 30-day forecast for Canada. The point forecast is the white line, the 80% and 95% forecast intervals are the blue shaded areas. I made two forecasts, the first on December 1st, 2020, the second on February 18th, 2021:
The last part of the script defines the Plumber endpoint / for a GET request. One of the nicest features of Plumber is that you can create a web API by decorating the R source code with special #* comments. These annotations will tell Plumber how to handle the requests, what kind of parsers and formatters to use, etc. The current setup will treat the function arguments as URL parameters. The default content type for the response is JSON, thus we do not need to specify it.
#* COVID
#* @get /
function(region, cases, window, last) {
  if (!missing(window))
    window <- as.numeric(window)
  covid_forecast(region, cases, window, last)
}
The covid_forecast arguments can be missing except for region. This makes the corresponding URL parameters optional. We have to remember that URL form encoded parameters will be of type character, thus checking type and making appropriate type conversions is necessary (i.e. as.numeric() for the window argument).
Build, push, and deploy the function
Now you can use faas-cli up to build, push, and deploy the COVID-19 forecast function to your OpenFaaS cluster:
faas-cli up -f covid-forecast.yml
Test the function’s deployed instance with curl:
curl -X GET -G \
  $OPENFAAS_URL/function/covid-forecast \
  -d region=canada-combined \
  -d cases=confirmed \
  -d window=4 \
  - last=2021-02-18
Or simply by visiting the URL $OPENFAAS_URL/function/covid-forecast?region=canada-combined&window=4&last=2021-02-18.
The output should be something like this:
{
    "Date":["2021-02-19","2021-02-20","2021-02-21","2021-02-22"],
    "Point Forecast":[2861.5922,2871.8024,2879.9795,2886.5285],
    "Lo 80":[1694.8092,1695.4395,1686.1983,1667.6804],
    "Hi 80":[4028.3753,4048.1652,4073.7608,4105.3767],
    "Lo 95":[1077.1515,1072.7106,1054.2487,1022.4611],
    "Hi 95":[4646.0329,4670.8941,4705.7104,4750.596]
}
Wrapping up
In this post I showed how to use the R templates for OpenFaaS. We built a serverless function that consumes data from an external API, fits exponential smoothing model, and makes a forecast. The data API with the forecasting function can be added to web applications to provide timely updates on the fly. Here are some resources for taking you further:
- Learn about alternative ways of passing parameters to the COVID-19 function
- See the list of available R templates for OpenFaaS
- Check out other R examples with OpenFaaS
Now you might ask why you should care about R in a serverless landscape. R is being used by data science teams. The OpenFaaS templates I presented here can reduce time to production by wrapping R code into serverless functions or microservices without significant overhead. If you are an R user, go ahead and try the templates with one of your use cases. If you are not an R user but this introduction piqued your interest, you can find great introductory courses on freeCodeCamp. The R for data science book gives a concise and modern overview of working with data in R.

Peter Solymos
Biologist. Data scientist. Co-founder of Analythium