OpenTelemetry is an open-source observability framework. This article shows you how to use OpenTelemetry to capture traces from OpenFaaS functions.
Function trace of the order function accessing a PostgreSQL database and invoking the order-confirmation function. The function is auto-instrumented, exporting traces for both database queries and HTTP requests without requiring any code changes or manual span definitions.
OpenFaaS functions can be instrumented manually using OpenTelemetry by either explicitly adding code to the function to capture telemetry data or, for supported languages, by leveraging auto-instrumentation. Auto-instrumentation uses built in tools or agents to automatically collect telemetry without changing your function code.
While OpenTelemetry aims to be a comprehensive solution that covers traces, logs and metrics we are going to focus exclusively on traces in this article. Traces can be a great addition to the wide range of Prometheus metrics OpenFaaS already makes available for monitoring functions.
What value does tracing bring to functions?
By collecting traces from functions, especially in more complex applications where functions are chained together or where they are calling a lot of external services, traces can help you:
- Identify performance bottlenecks.
- Detect errors and perform root cause analysis.
- Understand system behaviour.
However tracing comes with some trade-offs as well. It requires additional infrastructure, such as cloud storage or compute resources, which may increase costs, and adds cognitive overhead from instrumenting functions and managing telemetry data.
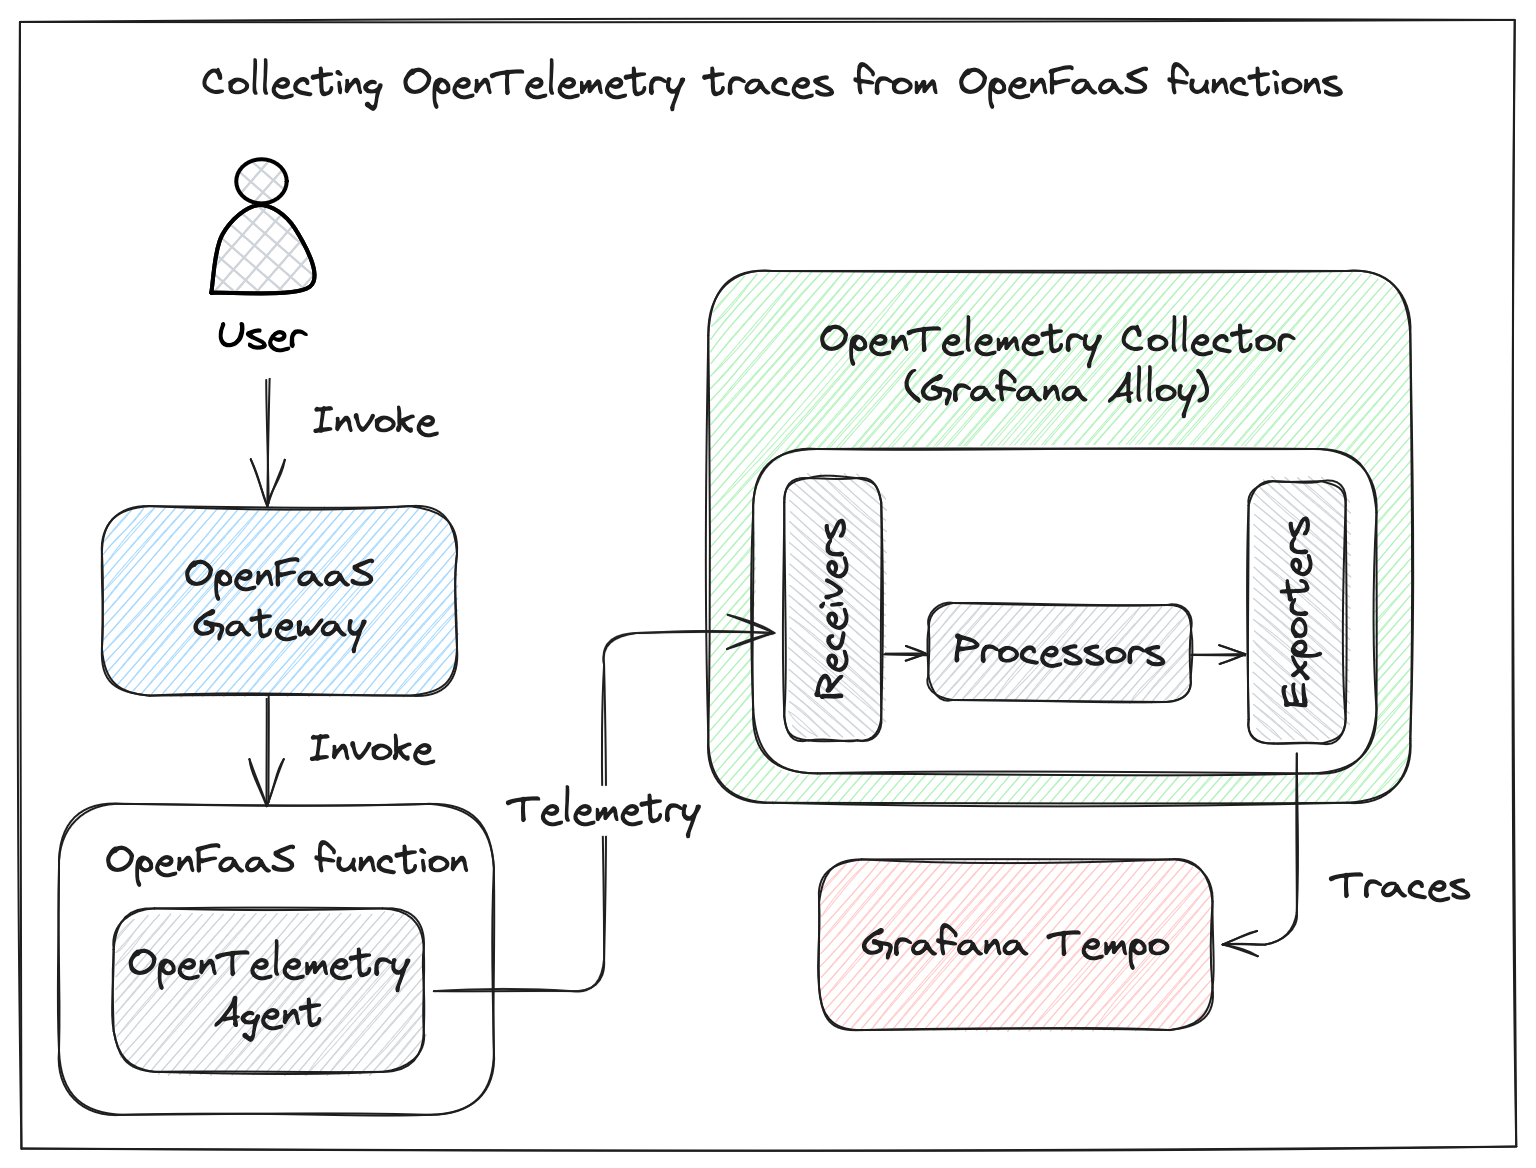
Diagram showing the different components involved in collecting traces from functions.
What we’ll cover
This tutorial shows you how to use OpenTelemetry to capture traces from OpenFaaS functions, helping you debug issues and optimize performance. We’ll use auto-instrumentation to keep things simple, setting up a tracing pipeline with open-source tools. Here’s what we’ll cover:
- Deploy Grafana Tempo as the backend for storing traces.
- Run and configure Grafana Alloy as a Collector for traces.
- Instrument Node.js and Python functions without making changes to the function code.
- Explore and visualize traces with Grafana.
- Extend an auto-instrumented function with additional custom spans.
- How to use OpenTelemetry with OpenFaaS Edge.
Prepare the cluster for telemetry collection
Before instrumenting functions we need to prepare our cluster for collecting and storing telemetry data.
OpenTelemetry works by collecting telemetry data (metrics, logs, traces) from applications using SDKs or agents. This data is sent to an OpenTelemetry Collector, which processes and exports it to a backend storage system (Jaeger, Zipkin, Prometheus or vendor-specific backend) for analysis and visualization.
When using OpenTelemetry, the Collector is a vendor-agnostic proxy that can receive, process and filter telemetry data before sending it to one or more backends for storage. We are going to deploy Grafana Alloy as a Collector. As the storage backend for traces we will be using Grafana Tempo. We will not be collecting logs or metrics in this tutorial.
Deploy Grafana Tempo
The tracing backend will receive data from the application using the OpenTelemetry Protocol (OTLP) and store it to be queried and retrieved for inspection and visualization. We will deploy Grafana Tempo to our cluster using the Helm chart.
Tempo uses Object Storage to store its data. We are going to use MinIO (GNU AGPL v3) as the storage backend which is included in the Helm chart for demonstration purposes only. When using Tempo in production you should configure a different storage option. Tempo supports S3 compatible storage backends like Seaweedfs (Apache-2.0) or cloud based options such as AWS S3, Azure Blob storage, Google Cloud Storage, etc.
See the Tempo Helm chart guide for more information.
All monitoring components are going to be installed in the monitoring namespace. Create this namespace before continuing:
kubectl create namespace monitoring
Install the grafana helm repository:
helm repo add grafana https://grafana.github.io/helm-charts
helm repo update
Create the tempo-values.yaml file with the following values:
storage:
  trace:
    backend: s3
    s3:
      access_key: 'grafana-tempo'
      secret_key: 'supersecret'
      bucket: 'tempo-traces'
      endpoint: 'tempo-minio:9000'
      insecure: true
# MinIO storage configuration
# Note: MinIO should not be used for production environments. This is for demonstration purposes only.
minio:
  enabled: true
  mode: standalone
  rootUser: grafana-tempo
  rootPassword: supersecret
  buckets:
    # Default Tempo storage bucket
    - name: tempo-traces
      policy: none
      purge: false
# Specifies which trace protocols to accept by the gateway.
traces:
  otlp:
    grpc:
      enabled: true
    http:
      enabled: true
  zipkin:
    enabled: false
  jaeger:
    thriftHttp:
      enabled: false
Install or update Tempo:
helm upgrade --install \
  tempo grafana/tempo-distributed \
  --namespace monitoring \
  --values tempo-values.yaml
Check the status of the Tempo pods:
kubectl -n monitoring get pods
Deploy Grafana Alloy
We deploy Grafana Alloy through Helm and configure it to receive OpenTelemetry data using the OpenTelemetry Protocol (OTLP).
We configure Alloy directly using the Helm configuration but you can create a separate ConfigMap from a file if that is preferred. See Configure Grafana Alloy on Kubernetes for more info.
The alloy-values.yaml file:
alloy:
  configMap:
    content: |
      otelcol.exporter.otlp "tempo" {
        client {
          endpoint = "tempo-distributor.monitoring.svc.cluster.local:4317"
          tls {
            insecure = true
          }
        }
      }

      otelcol.processor.batch "default" {
        output {
          traces = [otelcol.exporter.otlp.tempo.input]
        }
      }

      otelcol.receiver.otlp "otlp_receiver" {
        grpc {
          endpoint = "0.0.0.0:4317"
        }

        http {
          endpoint = "0.0.0.0:4318"
        }

        output {
          traces = [otelcol.processor.batch.default.input]
        }
      }
  extraPorts:
  - name: "otel-collector-grpc"
    port: 4317
    targetPort: 4317
    protocol: "TCP"
  - name: "otel-collector-http"
    port: 4318
    targetPort: 4318
    protocol: "TCP"
The alloy.configMap.content section contains the content of the Alloy configuration. The config uses three components to form a minimal pipeline.
-
Configure an OTLP exporter to send data to a backend for storage.
The otelcol.exporter.otlp component is configured for exporting telemetry data over OTLP to our in cluster Tempo deployment.
-
Configure processor components
Production-ready Alloy configurations shouldn’t send OpenTelemetry data directly to an exporter for delivery. Instead, data is usually sent to one or more processor components that perform various transformations on the data.
otelcol.processor.batch is used to batch data before sending it to the exporter to reduce the number of network requests.
-
Configure an OpenTelemetry Protocol receiver
otelcol.receiver.otlp is used to configure Alloy to receive telemetry data over the network using the OpenTelemetry Protocol. In this case we allow applications to send data over either HTTP or gRPC. Both endpoints listen for traffic on all interfaces.
Checkout the docs for more details on how to configure Grafana Alloy to collect OpenTelemetry data
The OTLP receiver needs to be reachable by functions so they can send their telemetry data. The extraPorts parameter is used to add both HTTP and gRPC ports to the alloy service that is created by the Chart.
To deploy Alloy to the cluster run:
# Add and/or update the Grafana Helm chart repository
helm repo add grafana https://grafana.github.io/helm-charts
helm repo update
# Deploy or update Alloy
helm upgrade --install \
  alloy grafana/alloy \
  --namespace monitoring \
  --values alloy-values.yaml
# Verify that the Alloy pods are running
kubectl get pods --namespace monitoring
Zero-code instrumentation of OpenFaaS functions
OpenTelemetry zero code instrumentation allows you to collect telemetry data from your OpenFaaS functions without making any changes to your functions code.
Instead of manually adding OpenTelemetry SDK calls to your codebase, auto-instrumentation relies on agents to inject the necessary instrumentation at runtime.
At the time of writing OpenTelemetry has auto-instrumentation support for JavaScript, Python, PHP, Java and .NET with Go support being a work in progress.
For most languages using auto-instrumentation for OpenFaaS functions will require you to customise the language template. There are two ways to customise a template:
- Fork the template repository and modify the template. Recommended method that allows for distribution and reuse of the template.
- Pull the template and apply patches directly in the
./template/<language_name>directory. Good for quick iteration and experimentation with template modifications. The modified template can not be shared and reused. Changes may get overwritten when pulling templates again.
We might look into supporting OpenTelemetry auto instrumentation directly in the official templates.
Quick note as you begin this section. In this example we will show how you can use auto instrumentation with two of our most popular commonly used function languages, Node.js and Python. We will use the second option to modify the templates and patch them directly in the ./template directory.
Instrument a Node.js function
Modify the template
Pull the latest node template:
faas-cli template store pull node20
Add the required packages for zero code instrumentation to the template:
cd ./template/node20
npm install --save @opentelemetry/api
npm install --save @opentelemetry/auto-instrumentations-node
Create a new function
Create a new function using the modified template:
faas-cli new echo --lang node20
The auto-instrumentation module can be configured through environment variables which can be set for each function in the stack.yaml configuration.
functions:
  echo:
    lang: node20
    handler: ./echo
    image: ${REPO:-ttl.sh}/${OWNER:-openfaas}/echo:0.0.1
    environment:
      OTEL_SERVICE_NAME: echo.${NAMESPACE:-openfaas-fn}
      OTEL_TRACES_EXPORTER: ${EXPORTER:-otlp}
      OTEL_METRICS_EXPORTER: none
      OTEL_LOGS_EXPORTER: none
      OTEL_EXPORTER_OTLP_ENDPOINT:${OTEL_EXPORTER_OTLP_ENDPOINT:-alloy.monitoring.svc.cluster.local:4317}
      NODE_OPTIONS: "--require @opentelemetry/auto-instrumentations-node/register"
We are making use of environment variable substitution in the stack file to make parameters easily configurable when deploying the function.
OTEL_SERVICE_NAME sets the name of the service associated with the telemetry and is used to identify telemetry for a specific function. It can be set to any value you want be we recommend using the clear function identifier <fn-name>.<fn-namespace>.
The NODE_OPTIONS environment variable needs to have the value --require @opentelemetry/auto-instrumentations-node/register to register and initialize the auto instrumentation module.
The OTEL_EXPORTER_OTLP_ENDPOINT env variable is used to specify the endpoint of the OTLP receiver to which telemetry data should be sent. The URL of the Alloy instance we deployed in the cluster is used as the default value.
For this tutorial we are only interested in traces, by setting OTEL_METRICS_EXPORTER and OTEL_LOGS_EXPORTER to none we disable the metrics and logs exporters.
By default, all supported instrumentation libraries are enabled. Configuration options can be used to disable or enable specific instrumentations.
Checkout the configuration docs to see the full range of configuration options.
Deploy the function
Test the function locally with faas-cli local-run and the console exporter. This should output the exporter outputs to stdout/console, a good way to quickly check the instrumentation configuration.
EXPORTER="console" faas-cli local-run echo
Invoke the function to verify traces get exported to the console:
curl -i http://127.0.0.1:8080 -d "Hello OTEL"
Instrument a Python function
We will be using the python3-http template, one of the two templates that we recommend for Python functions. It is based upon Alpine Linux, has a small image size and is intended for pure python only. There is another variant of the template, python3-http-debian that is based upon Debian Linux and recommended when using packages that use native C modules such as as SQL, Kafka, Pandas, etc.
The instructions that we show here for modifying the template work for both template variants.
Modify the template
Pull the latest python3-http template:
faas-cli template store pull python3-http
Add the required packages for auto instrumentation to the requirements file ./template/python3-http/requirement.txt:
opentelemetry-distro
opentelemetry-exporter-otlp
Update the templates ./template/python3-http/Dockerfile to run the bootstrap command after installing the user specified packages.
# Build the function directory and install any user-specified components
USER app

RUN mkdir -p function
RUN touch ./function/__init__.py
WORKDIR /home/app/function/
COPY --chown=app:app function/requirements.txt	.
RUN pip install --no-cache-dir --user -r requirements.txt
+ RUN opentelemetry-bootstrap -a install
The opentelemetry-bootstrap -a install command reads through the list of packages installed in your active site-packages folder, and installs the corresponding instrumentation libraries for these packages, if applicable. The OpenTelemetry Python agent uses monkey patching to modify functions in these libraries at runtime.
Update the function process in ./template/python3-http/template.yamlto run "opentelemetry-instrument.
language: python3-http
- fprocess: python index.py
+ fprocess: opentelemetry-instrument python index.py
Create a new function
Create a new function using the modified template:
faas-cli new greet --lang python3-http
The Python agent can be configured through environment variables set on the function. You can set environment variables for a function in the stack.yaml configuration.
functions:
  greet:
    lang: python3-http
    handler: ./greet
    image: ${REPO:-ttl.sh}/${OWNER:-openfaas}/greet:0.0.1
    environment:
      OTEL_SERVICE_NAME: greet.${NAMESPACE:-openfaas-fn}
      OTEL_TRACES_EXPORTER: ${EXPORTER:-otlp}
      OTEL_METRICS_EXPORTER: none
      OTEL_LOGS_EXPORTER: none
      OTEL_EXPORTER_OTLP_ENDPOINT: ${OTEL_EXPORTER_OTLP_ENDPOINT:-alloy.monitoring.svc.cluster.local:4317}
      OTEL_EXPORTER_OTLP_TRACES_INSECURE: true
We use environment variable substitution in the stack file to make parameters easily configurable when deploying the function.
OTEL_SERVICE_NAME sets the name of the service associated with the telemetry and is used to identify telemetry for a specific function. It can be set to any value you want, but we recommend using the clear function identifier <fn-name>.<fn-namespace>.
The OTEL_EXPORTER_OTLP_ENDPOINT env variable is used to specify the endpoint of the OTLP receiver to which telemetry data should be sent. The URL of the Alloy instance we deployed in the cluster is used as the default value.
For this tutorial we are only interested in traces, by setting OTEL_METRICS_EXPORTER and OTEL_LOGS_EXPORTER to none we disable the metrics and logs exporters.
By default the Agent will instrument any supported package it can. You can omit specific packages from instrumentation by using the OTEL_PYTHON_DISABLED_INSTRUMENTATIONS environment variable.
Checkout the configuration docs for more details and to see all available configuration options.
Deploy the function
You can deploy the function locally using faas-cli local-run to quickly verify instrumentation is working. Use environment variable substitution to change the exporter to console. This ensures telemetry data is being written to stdout/console, instead of being sent to the configured exporter endpoint.
EXPORTER=console faas-cli local-run greet
Invoke the function to verify traces get exported to the console:
curl -i http://127.0.0.1:8080
The deploy the function to the cluster run:
faas-cli up
Explore traces
In this section we are going to deploy a Grafana instance and connect our Tempo data source to view and analyze trace data.
You can deploy Grafana using Helm or use arkade for a quick installation.
Install Grafana with arkade in the monitoring namespace
arkade install grafana --namespace monitoring
Get the Grafana password to login with username admin:
kubectl get secret --namespace monitoring grafana -o jsonpath="{.data.admin-password}" | base64 --decode ; echo
Add the Tempo instance that we deployed in the first section as a datasource in Grafana: http://tempo-query-frontend.monitoring.svc.cluster.local:3100
You can now use the Explore tab to start exploring traces. Make sure to select Tempo as the datasource.
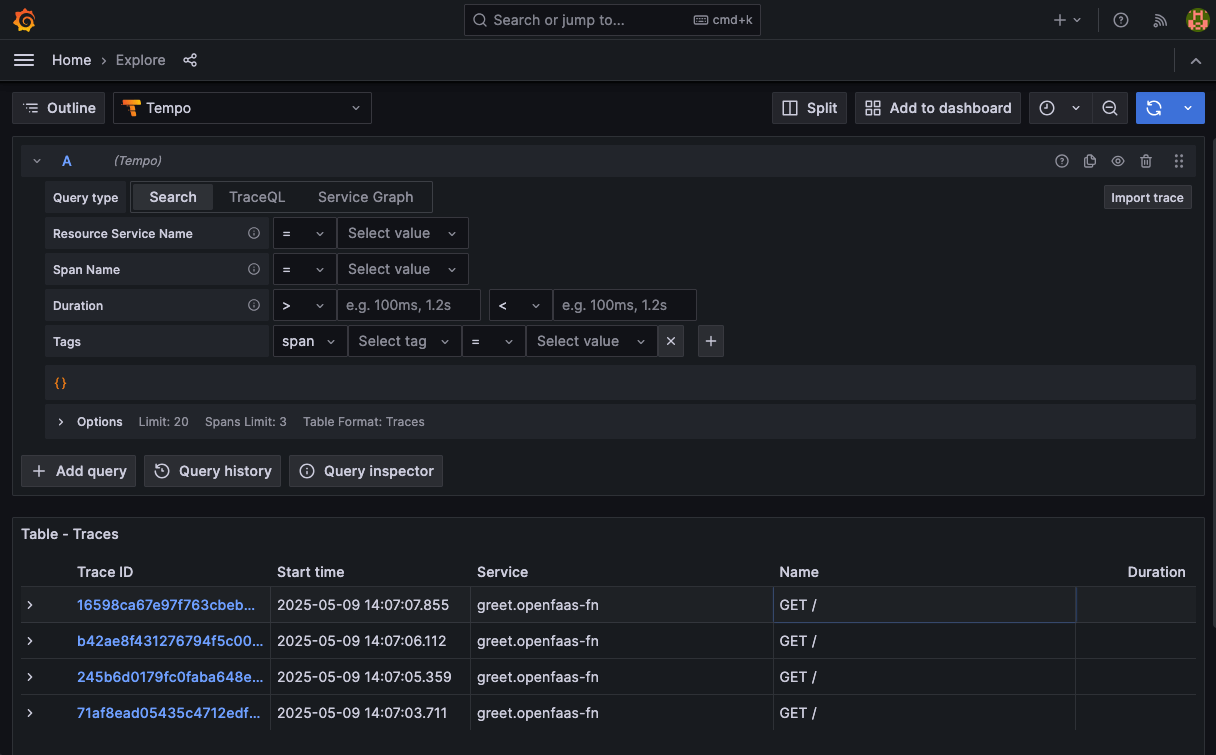
Overview of the most recent trace IDs.
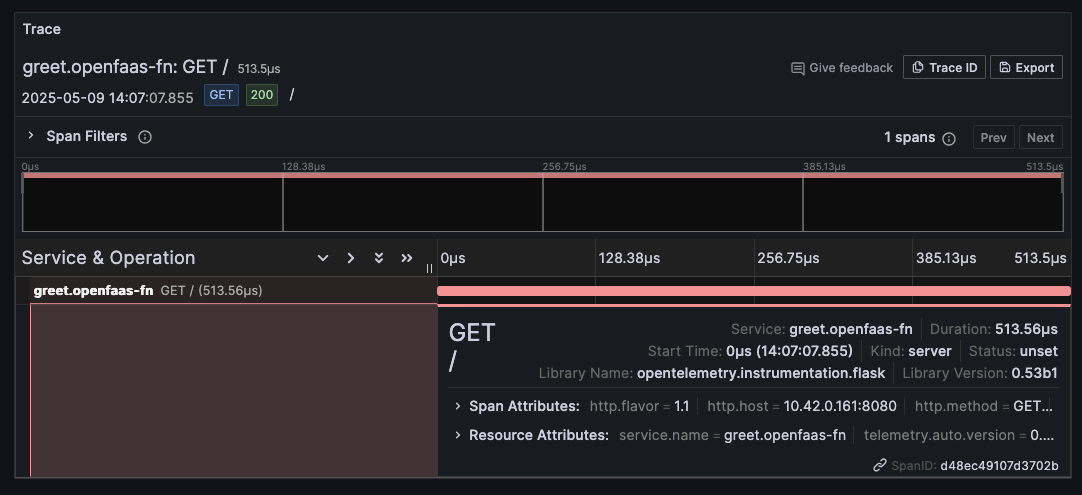
Trace detail for one of the invocations of the greet function.
Checkout the Grafana documentation for more info on how to add traces visualizations to a Grafana dashboard
Add manual traces to your function
Auto instrumentation captures traces from the standard library and known libraries at the edges of the function, such as inbound and outbound HTTP requests. To capture traces for custom business logic or spans for things that go on inside the function you will have to add some manual instrumentation.
We will create a new auto-instrumented python function and extend it with custom spans.
Create a new function using the modified python3-http template and append it to the function stack:
faas-cli new order --lang python3-http --append stack.yaml
Update the function handler:
import time
from opentelemetry import trace

# Get a tracer
tracer = trace.get_tracer(__name__)

def handle(event, context):
    process_order(event.query['id'])

    # Simulate some other work before returning  a request
    time.sleep(0.3)

    return {
        "statusCode": 200,
        "body": "Order processed"
    }

def process_order(order_id):
    # Manually create a span
    with tracer.start_as_current_span("process_order"):
        # you can also add attributes or events
        trace.get_current_span().set_attribute("order.id", order_id)
        trace.get_current_span().add_event("Order processing started")

        # simulate some work
        time.sleep(1)

        result = "done"
        trace.get_current_span().add_event("Order processing finished")
        return result
In the handler we create a function process_order that simulates some custom business logic to process an order. In the function a new span is initialized. The order id is read from a request header named id and included in the custom span as an attribute. We also add some events to the span to indicate the processing state.
Update the stack.yaml and configure the OpenTelemetry agent for the order function:
functions:
  order:
    lang: python3-http
    handler: ./order
    image: ${REPO:-ttl.sh}/${OWNER:-openfaas}/order:0.0.1
    environment:
      OTEL_SERVICE_NAME: order.${NAMESPACE:-openfaas-fn}
      OTEL_TRACES_EXPORTER: ${EXPORTER:-otlp}
      OTEL_METRICS_EXPORTER: none
      OTEL_LOGS_EXPORTER: none
      OTEL_EXPORTER_OTLP_ENDPOINT: ${OTEL_EXPORTER_OTLP_ENDPOINT:-alloy.monitoring.svc.cluster.local:4317}
      OTEL_EXPORTER_OTLP_TRACES_INSECURE: true
Build and deploy the function:
faas-cli up --filter order
Invoke the function and inspect the trace in Grafana. You should see the custom process_order span as part of the function invocation.
curl -i "http://127.0.0.1:8080/function/order?id=1"
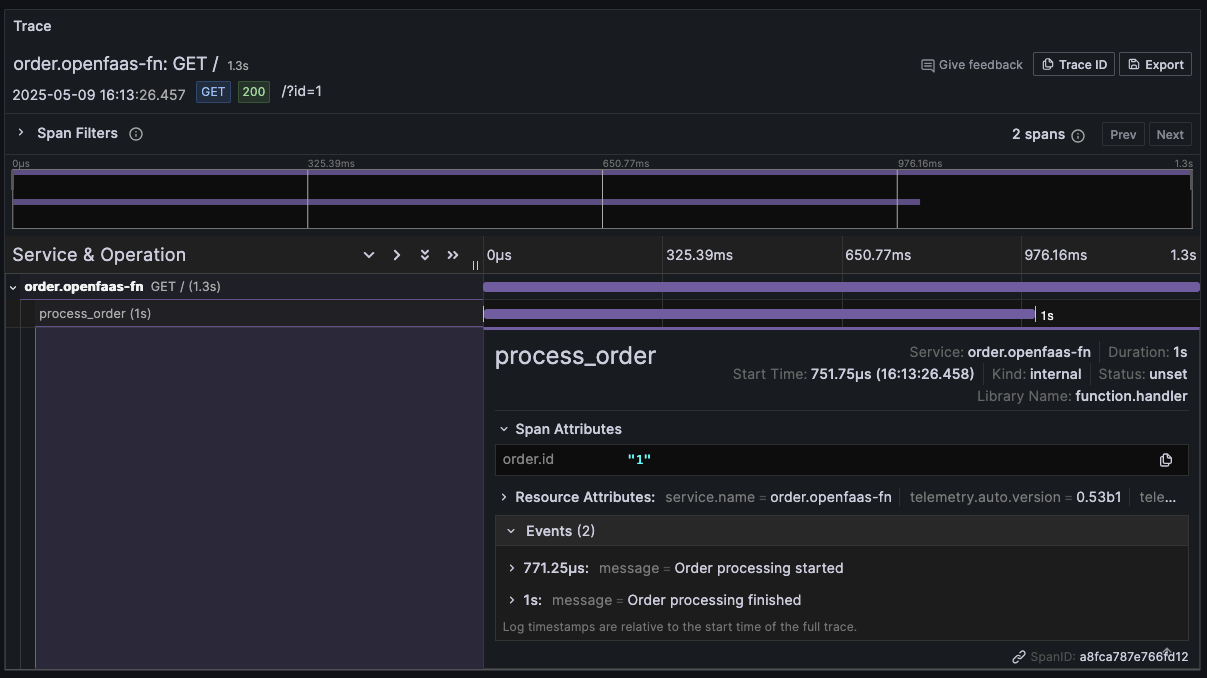
Trace detail showing the function invocation with the custom span. The span has the order id attribute and events that we added to it.
Capture traces from libraries and frameworks
Traces and auto-instrumentation can become really valuable when you have more complex function workflows where functions are chained together or interact with external systems. These functions most likely use third-party Python libraries to perform actions like query a database, make HTTP requests, talk to a message broker or key value store, etc. Auto-instrumentation allows you to capture traces from many popular libraries without changing your code.
We will expand the order function to simulate this kind of workflow. The order function will look up an order in a PostgreSQL database and invoke a second function, order-confirmation when it is done processing the order.
To follow along with this example you can quickly deploy a PostgreSQL database in your cluster using arkade:
arkade install postgresql
arkade prints out connection instructions and the command to get the database password. Connect to the database and seed it with an orders table and some dummy content.
Create the orders table:
CREATE TABLE orders (
    id SERIAL PRIMARY KEY,
    customer_name VARCHAR(100) NOT NULL,
    order_date DATE NOT NULL DEFAULT CURRENT_DATE,
    total_amount NUMERIC(10, 2) NOT NULL
);
Insert a sample order:
INSERT INTO orders (customer_name, order_date, total_amount)
VALUES ('Alice Johnson', '2025-05-12', 149.99);
Psycopg will be used to query the Postgresql database and the Requests package to make HTTP requests. Both packages need to be appended to the requirements.txt file for the order function.
opentelemetry-distro
opentelemetry-exporter-otlp
+psycopg2-binary
+requests
Update the handler.py to get orders from the database and invoke the order-confirmation function.
import time
from opentelemetry import trace
+ import psycopg2
+ import requests

# Get a tracer
tracer = trace.get_tracer(__name__)

+ # Database connection settings
+ db_config = {
+     'dbname': 'postgres',
+     'user': 'postgres',
+     'password': '<replace_with_db_password>',
+     'host': 'postgresql.default.svc.cluster.local',
+     'port': '5432'  # default PostgreSQL port
+ }

+ confirmation_url = 'http://gateway.openfaas.svc.cluster.local:8080/function/order-confirmation'

def handle(event, context):
    process_order(event.query['id'])
+    # Send confirmation request
+    requests.post(confirmation_url, json={'order_id': event.query['id']})

    return {
        "statusCode": 200,
        "body": "Order processed"
    }

def process_order(order_id):
    # Manually create a span
    with tracer.start_as_current_span("process_order"):
        # you can also add attributes or events
        trace.get_current_span().set_attribute("order.id", order_id)
        trace.get_current_span().add_event("Order processing started")

+        # Get order from database
+        order = get_order_from_db(order_id)

        # simulate some work for the order
        time.sleep(0.4)

        result = "done"
        trace.get_current_span().add_event("Order processing finished")
        return result

+ def get_order_from_db(order_id):
+    try:
+        # Connect to the database
+        conn = psycopg2.connect(**db_config)
+        cursor = conn.cursor()
+
+        # Execute a query to get the order
+        cursor.execute("SELECT * FROM orders WHERE id = %s", (order_id,))
+
+
+       order = cursor.fetchone()
+        return order
+
+    except psycopg2.Error as e:
+        print("Database error:", e)
+        return None
+
+    finally:
+        if 'cursor' in locals():
+            cursor.close()
+        if 'conn' in locals():
+            conn.close()
Add a new function order-confirmation and update the stack.yaml to configure the OpenTelemetry agent for the function.
faas-cli new order-confirmation --lang python3-http --append stack.yaml
functions:
  order:
    lang: python3-http
    handler: ./order-confirmation
    image: ${REPO:-ttl.sh}/${OWNER:-openfaas}/order-confirmation:0.0.1
    environment:
      OTEL_SERVICE_NAME: order-confirmation.${NAMESPACE:-openfaas-fn}
      OTEL_TRACES_EXPORTER: ${EXPORTER:-otlp}
      OTEL_METRICS_EXPORTER: none
      OTEL_LOGS_EXPORTER: none
      OTEL_EXPORTER_OTLP_ENDPOINT: ${OTEL_EXPORTER_OTLP_ENDPOINT:-alloy.monitoring.svc.cluster.local:4317}
      OTEL_EXPORTER_OTLP_TRACES_INSECURE: true
In a real application this function would perform jobs like sending out the order confirmation via email. To keep things simple we are just going to sleep a couple of milliseconds to simulate some work.
import time

def handle(event, context):

    # simulate sending order confirmation email
    time.sleep(0.2)

    return {
        "statusCode": 200,
        "body": "Confirmation order"
    }
Deploy both functions:
faas-cli up
Invoke the order function and view the trace in Grafana.
curl -i "http://127.0.0.1:8080/function/order?id=1"
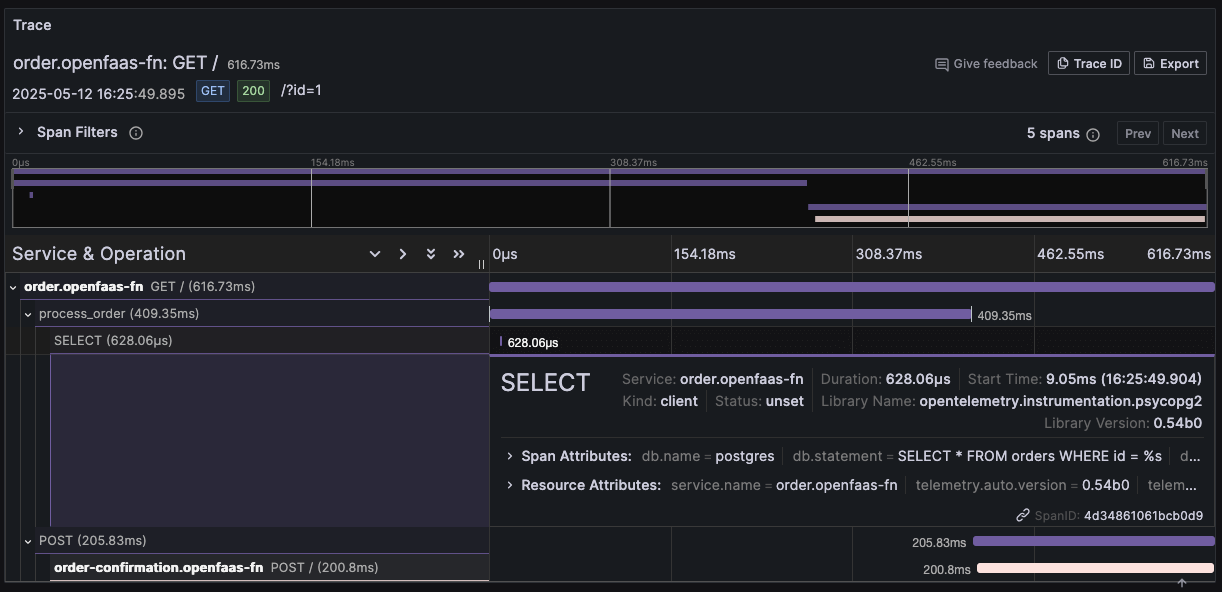
Screenshot of a trace visualization for the order function in Grafana
The trace includes 5 spans. We can clearly see the different operations the function performed and how much time they took. The top level span for the GET request to orders.openfaas-fn shows the complete function invocation took 616.73ms. As children of that span we see our custom process_order span and the POST request made to the order-confirmation function. We also get a span with the details of the database query.
Note that we did not have to make any changes to get traces from the psycopg2 and requests package. The auto-instrumentation took care of that.
The Python agent by default will detect a Python program’s packages and instrument any packages it can. This makes instrumentation easy, but can also result in too much or unwanted data. You can omit specific packages from instrumentation by using the OTEL_PYTHON_DISABLED_INSTRUMENTATIONS environment variable. See: Disabling Specific Instrumentations for more details.
OpenTelemetry on OpenFaaS Edge
Collecting telemetry is also supported on OpenFaaS Edge. OpenFaaS Edge is a lightweight option for running OpenFaaS functions that does not use Kubernetes, ideal for edge computing environments.
When using OpenFaaS Edge the Alloy collector can be deployed as an additional service and configured to export traces to an external backend. Detailed instructions on how to configure Alloy and add it to the docker-compose.yaml file are available in our documentation.
Any instrumented function can be deployed to OpenFaaS Edge. Just make sure the OTEL_EXPORTER_OTLP_ENDPOINT environment variable is set correctly.
Modify the stack.yaml file and change the environment variable to alloy:4317. Or use the environment substitution to override it. In OpenFaaS Edge the service name can be used as the hostname.
# Use the stack.yaml from the previous section and override the OTLP endpoint.
OTEL_EXPORTER_OTLP_ENDPOINT=alloy:4317 faas-cli up
Conclusion
In this tutorial we showed how OpenTelemetry auto-instrumentation can be used to quickly get telemetry and traces for OpenFaaS functions without having to manually instrument your functions code.
We ran through the process of deploying and configuring a Collector, and tracing backend to collect and store traces for OpenFaaS functions. While we used Grafana Alloy as the Collector and Grafana Tempo to store traces these components can be exchanged easily without changing instrumentation for functions.
Other common open-source alternatives for collecting and storing traces include: Jaeger and Zipkin
If you are a Datadog user take a look at how to collect OpenTelemetry data in datadog. For more alternatives see: vendors who natively support OpenTelemetry
To support auto instrumentation some minor customisations to the OpenFaaS function templates are required. We walked through the steps to modify the Node.js and Python templates. With python we took it one step further and extended the auto instrumented traces with some custom spans.
Auto-instrumentation with OpenTelemetry Operator for Kubernetes
If you are using OpenFaaS on Kubernetes there is the option to use the OpenTelemetry Operator for Kubernetes for auto-instrumentation. The Operator supports injecting and configuring auto-instrumentation libraries for .NET, Java, Node.js, Python and Go functions. It requires no changes to your existing functions, however it comes with a couple of tradeoffs.
- Depending on the language, the instrumentation relies on init-containers, mounting volumes or using sidecars. This can increase the cold-start when autoscaling functions as it causing an extra delay when the container initializes.
- Go instrumentation works through a sidecar container that uses eBPF and requires elevated permissions for the function.
We recommend using function templates and the stack.yaml configuration described in this article instead. It does not have these tradeoffs and ensures your functions are portable to other OpenFaaS versions that do not use Kubernetes, like OpenFaaS Edge.
Reach out to us if you have any questions about OpenTelemetry for OpenFaaS functions, or OpenFaaS in general.

Han Verstraete
Associate Software Developer, OpenFaaS Ltd