Learn how the new diag plugin for faas-cli can be used to diagnose issues and make architecture reviews a hands-off exercise.
It helps you (or us together) to answer two questions: What’s breaking? Are we using OpenFaaS to its full potential?
Diag builds a HTML report, an instructions file for AI agents, graphs, and visualisations so you can explore the data and share if necessary, to get help. One command, no manual steps, nothing to forget.
Two case-studies
Misconfiguration leads to an outage in production
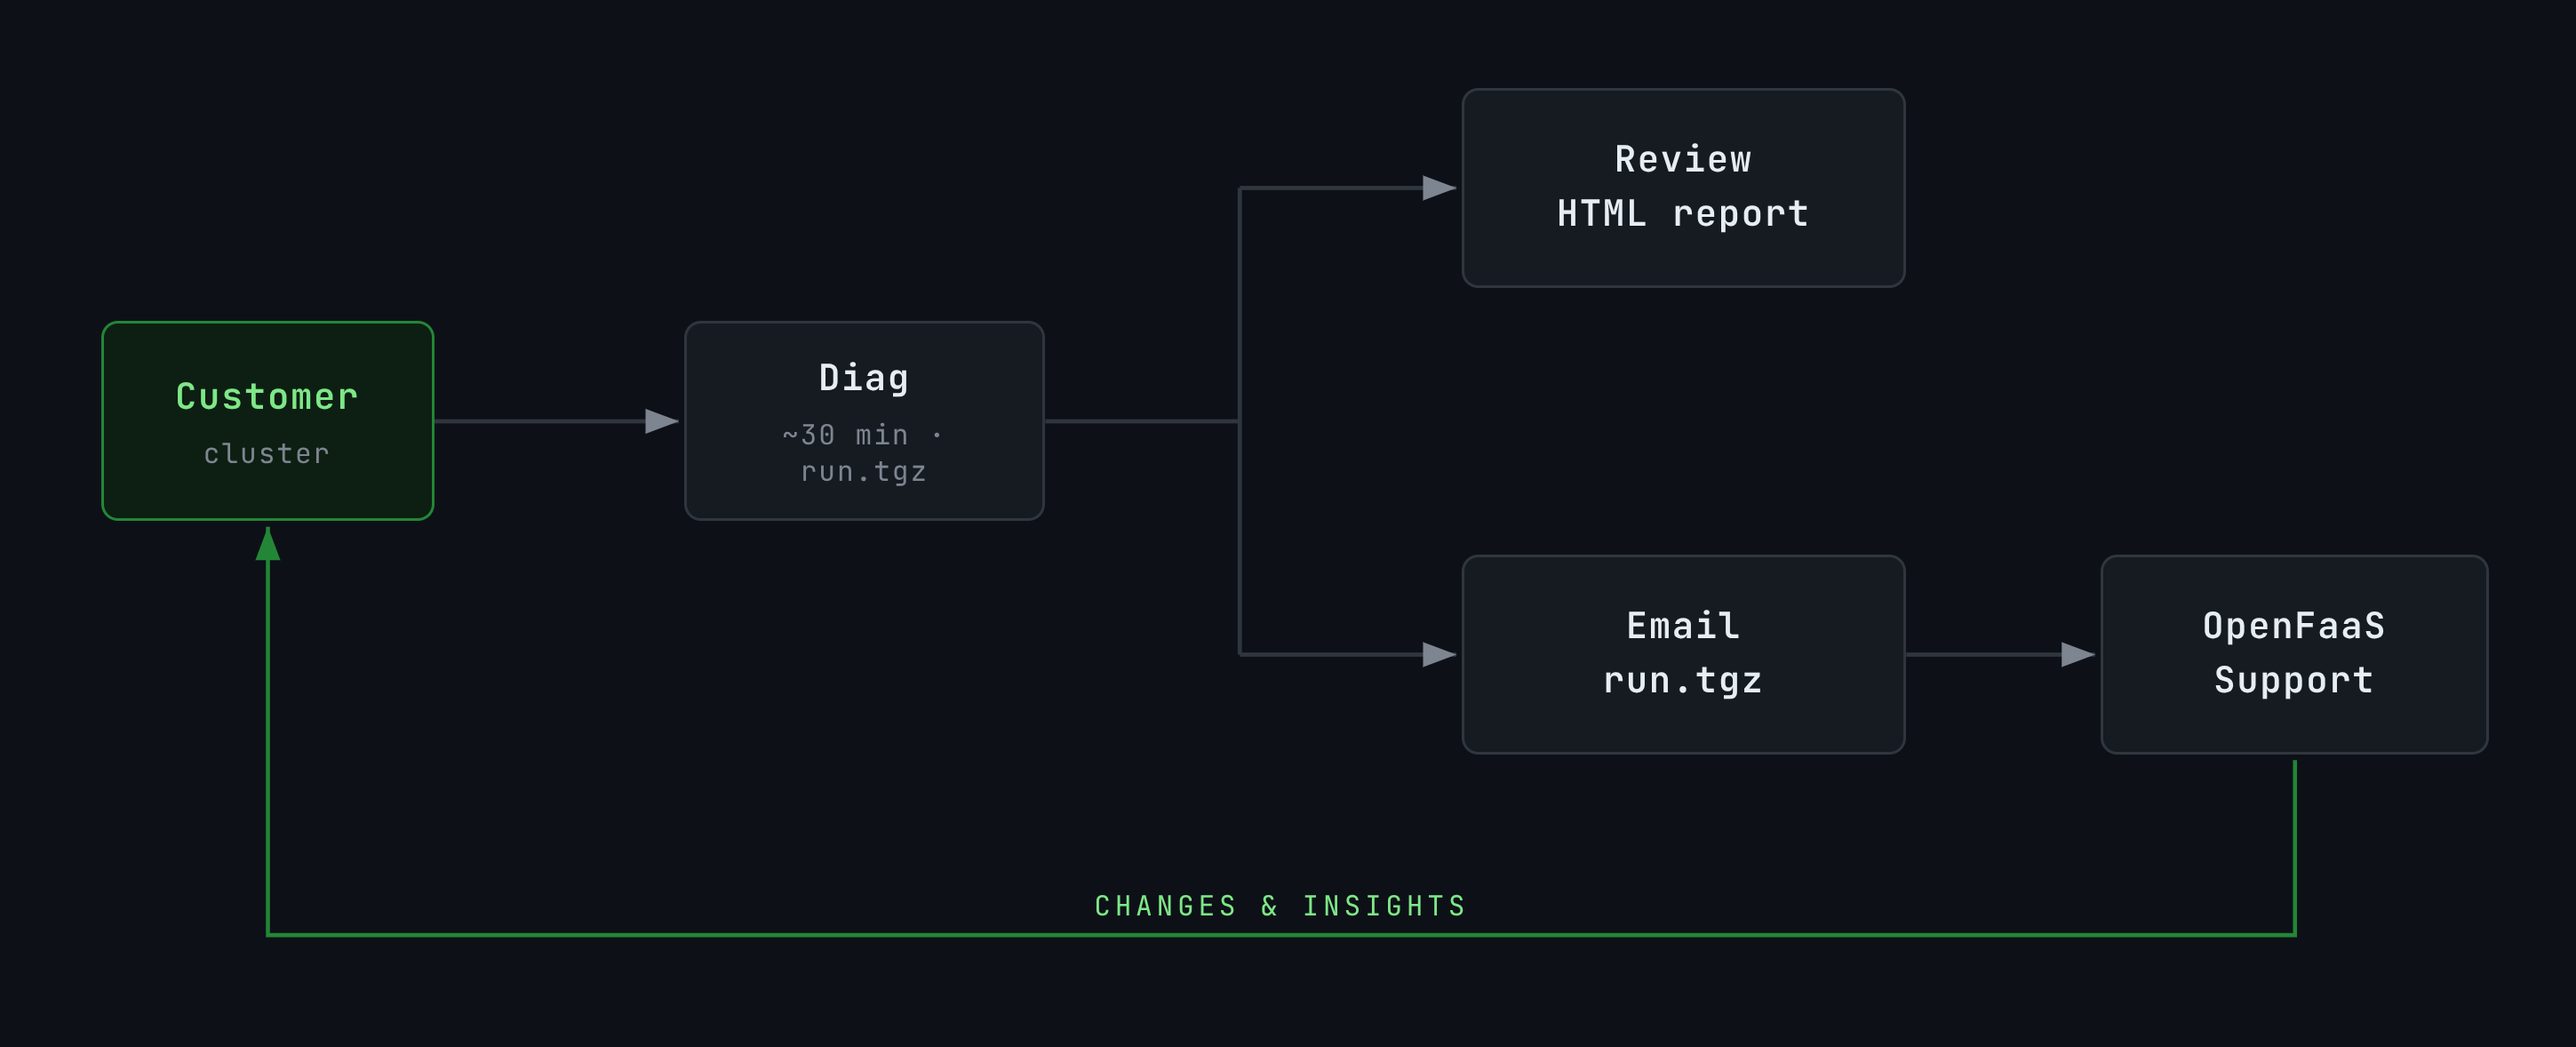
An enterprise customer using OpenFaaS for 3 years accidentally changed their gateway’s timeout to 0.5s from 2 hours.
An inadvertent change to values.yaml on the customer’s end enforced a half second timeout, causing functions to time-out unexpectedly. We requested a “diag” run, and within a 30 minutes had found the issue, advised the team, and got them up and running again.
It’s always DNS. Actually it was a bad node in EKS.
A defense contractor in the US that uses OpenFaaS for building AI analytics software started to complain of timeouts and reliability issues in production.
We sent them the troubleshooting guide, and said “Can you try these?” After a couple of weeks, they’d not run any of the commands, so we went them specific commands - they ran these and shared the output. It was helpful, but we needed more.
We then went down the route of trying to reproduce the issue locally, and couldn’t. We told the team to try HTTP readiness probes, which sometimes cure this kind of issue.
Eventually, after sending commands back and forth over the course of a few days, they sent over a “diag” run.
We saw network timeouts between core Pods like NATS, the Gateway and Prometheus. Even between containers in the same Pod. The insights helped them track it down to an EKS node that had “gone bad” and needed replacement.
Two main uses-cases
Self-service, and pain-free support
When something goes wrong in production, the last thing you want is to be sent to a troubleshooting guide and told to run half a dozen commands. Your product is on fire. People are starting to point the finger of blame. You just want it fixed.
Everything that could be relevant is collected: deployments, function definitions, logs, events, pod status, and Prometheus metrics. Run it, send us the archive, and we can start working on your issue immediately, without a back-and-forth asking you to gather more data.
Architecture review and Value extraction
Beyond troubleshooting, the data and graphs collected by faas-cli diag can help you answer broader questions about your setup: are you getting the most value possible from the product? Is there an OpenFaaS feature that could help with your type of workload? Is there a production incident waiting to happen because something’s been mixed up in the values.yaml?
The report generated by diag gives you a starting point. You can inspect invocation rates, error rates, replica counts, and resource usage without needing to set up dashboards or port-forward to Prometheus.
Reviews no longer have to be annual ceremonies.
What does it collect?
The diag tool gathers the following from your cluster:
- Deployment YAMLs — exported specs for OpenFaaS core components and functions
- Function CRs — Custom Resource definitions for deployed functions
- Kubernetes events — cluster events from the OpenFaaS and function namespaces
- Pod status — output from
kubectl getandkubectl describefor all relevant pods - Container logs — streamed via stern for real-time and retrospective log collection
- Node info — inventory and descriptions for all cluster nodes
- Helm values — user-supplied values for the OpenFaaS Helm release
- Ingress & Gateway API — Ingress, IngressClass, HTTPRoute, and GatewayClass resources
- Network Policies — NetworkPolicy resources from OpenFaaS and function namespaces
- Prometheus metrics — metrics snapshots and visualisations covering replicas, request rates, latencies, and resource usage
All collected data is written to a local directory and archived into a .tar.gz file for easy sharing. The tool is 100% offline — no information is shared with anyone, including OpenFaaS Ltd, by default.
Install the diag plugin
Install the plugin, and check the version. It’s useful to run this command before very run - because we’re actively improving the tool as we get feedback.
faas-cli plugin get diag
faas-cli diag version
Generate a report
By default, diag reads configuration from diag.yaml in your current directory. Generate that file first, then run the tool:
# Generate a `diag.yaml` config file
faas-cli diag config simple > diag.yaml

# Run diagnostics
faas-cli diag
The first command creates a diag.yaml with sensible defaults that works for most setups. The second starts the collection: it sets up port-forwards, streams logs, collects Kubernetes resources, and scrapes Prometheus metrics. Press Control+C once to stop gracefully, it will finish collecting and write all output to disk.
Staging and production
Here’s how you could collect data from both production and staging:
mkdir ~/diag
cd ~/diag

# Generate an initial config:
faas-cli diag config simple > diag.yaml

kubectl config use-context eks-staging-us-east-1
faas-cli diag "staging"

kubectl config use-context eks-prod-us-east-1
faas-cli diag "prod"
For more advanced options like targeting specific functions or using an external Prometheus instance, see the full configuration reference at the end of this post.
Running at scale with hundreds of namespaces
If you’re running a multi-tenant setup with hundreds of function namespaces, you probably don’t want to collect from all of them at once. Use the --namespace flag to target a specific subset:
faas-cli diag config simple --namespace tenant-1 --namespace tenant-2
Or use '*' to automatically discover all OpenFaaS function namespaces:
faas-cli diag config simple --namespace '*'
Exploring the report
Data is saved to ./run - either with a date and timestamp, or with the name of the run you passed.
diag "prod"creates./run/diag/diagon its own creates i.e../run/2026-03-10_14-30-00/
To explore the data, you can open the index.html file in those folders.
The report includes visualisations of Prometheus metrics such as function invocation rates, error rates, and replica counts, giving you a quick overview of cluster health without needing to set up Grafana or port-forward to Prometheus yourself.
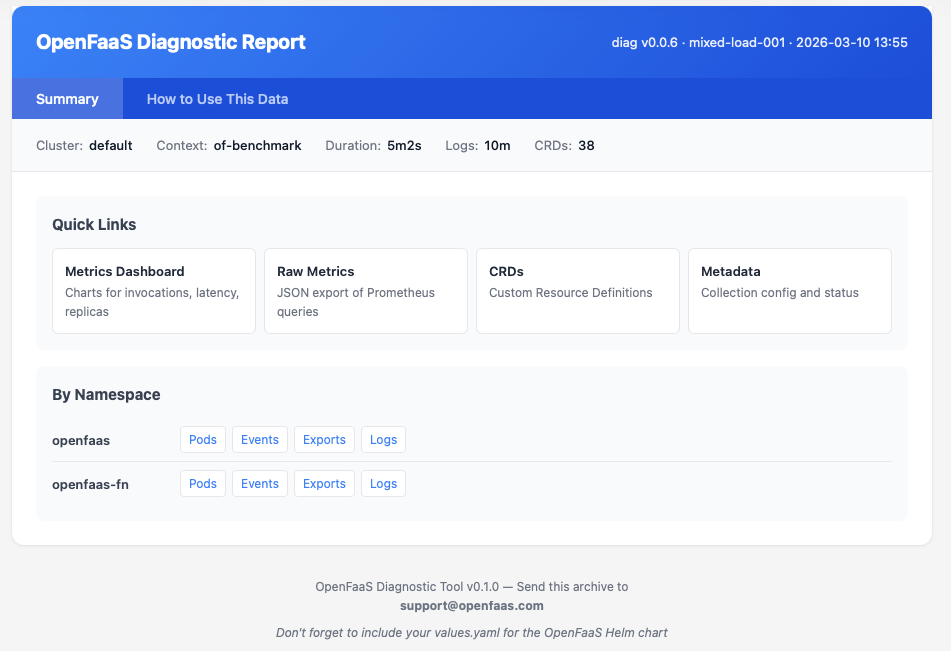
The report summary page with quick links to metrics, CRDs, pods, events, and logs per namespace.
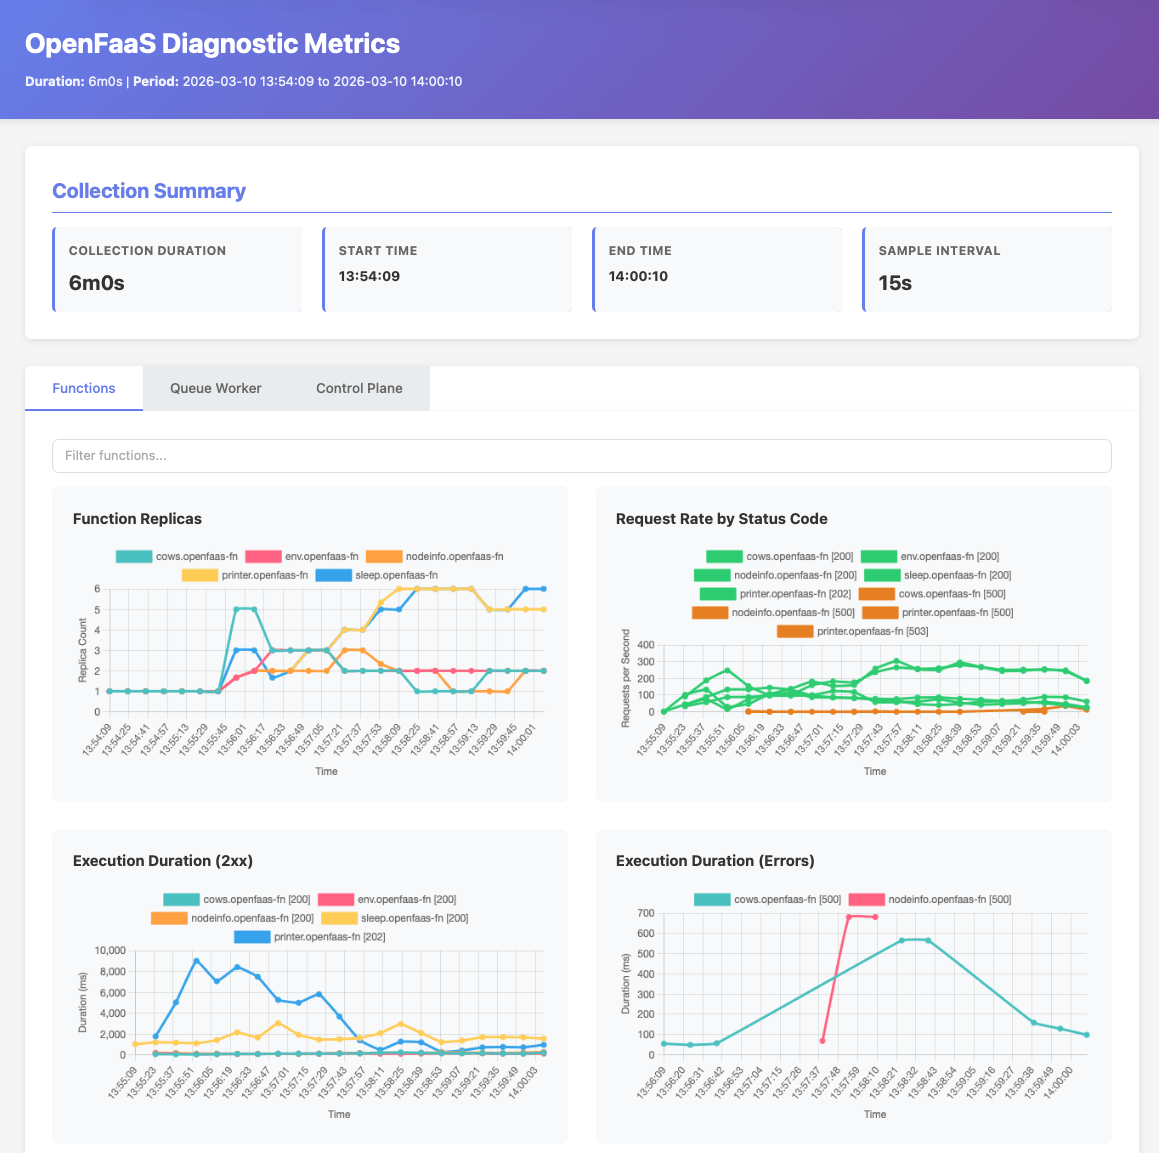
The metrics dashboard showing function replicas, request rates by status code, and execution duration.
Diag is AI ready
The output also includes an AGENTS.md file that instructs AI coding agents like Claude Code, Codex, and similar tools to interpret and diagnose issues from the collected data. This gives you a fast first pass for support investigations or architecture reviews using AI, while keeping the decision loop with your team.
But before you load up Claude Code, Codex, or Gemini, make sure that your organisation has any of the following:
- A zero-data retention agreement with your inference provider.
- Your own private deploymeny of a model to Azure/AWS/Google etc, with approved data policies.
- Or access to private, airgapped local GPUs and AI models.
- Have redacted all credentials, tokens, customer identifiers or confidential information
If in doubt, do not use any form of AI with the output, most issues can be found by humans on your end or ours.
Useful flags and options
| Flag / Command | Description | Example |
|---|---|---|
-d/--duration |
Auto-stop after a set duration | faas-cli diag -d 5m |
--age |
Collect logs from a past time window | faas-cli diag --age 1h |
diag [run-name] |
Custom name for the run (positional argument) | faas-cli diag incident-456 |
Wrapping up
The new faas-cli diag plugin gives you a fast, repeatable way to collect everything needed for support requests and architecture reviews. Instead of manually running a dozen kubectl commands, you get a single workflow that captures logs, events, pod status, and metrics — all archived and ready to share.
Whether you’re debugging an incident or reviewing your cluster setup, the workflow is the same: run faas-cli diag and explore the report. If you need our help, send us the archive.
For more details, see the Troubleshooting docs.
Appendix: full configuration reference
Generate the full configuration template with:
faas-cli diag config full
# Identify the cluster and kubectl context
clusterName: "production-cluster"
context: ""  # Leave empty to use current context

# Namespaces to collect from
namespaces:
  openfaas: openfaas
  functions:
    - openfaas-fn
    - staging-fn
    - production-fn

# Function filter patterns (glob-style)
functions:
  - 'api-*'
  - 'webhook-*'

# Prometheus configuration
prometheus:
  enabled: true
  service: prometheus
  targetPort: 9090
  # Use a custom URL if Prometheus is outside the openfaas namespace
  # url: "http://prometheus.monitoring.svc.cluster.local:9090"

# Gateway configuration
gateway:
  enabled: true
  service: gateway
  targetPort: 8080
  autoAuth: true

# What to collect
collection:
  deployments: true
  functionCRs: true
  events: true
  podStatus: true
  logs: true
  metrics: true
  logAge: "1h"

# Output directory and run name
output:
  directory: "./run"
  # runName: "incident-123"
A few options worth noting:
context- lets you target a specific kubectl context if you manage multiple clusters. Leave it empty to use whichever context is currently active.functions- uses glob patterns to filter which functions are collected. Use'*'for all, or patterns like'api-*'to narrow the scope on large clusters.prometheus.url- lets you point to an external Prometheus instance, bypassing the automatic port-forward.collection- toggles to disable individual collectors if you only need a subset of the data.logAge- controls how far back to collect logs retrospectively. Leave it empty to collect all available logs.

Han Verstraete
Associate Software Developer, OpenFaaS Ltd

Alex Ellis
Founder of @openfaas.